XRF Analysis of Metal and Glass: Apple Version
First - a note at what we will be looking at: X-ray Fluorescence (XRF) spectra. Try to think of these as color peaks. For example, the color red is 1.7 electron volts (eV). The color violet is about 3.1 eV. The color iron is about 6,400 eV, or 6.4 keV. Each element has a color on the spectrum - and this is what we will be looking at. The height of each peak is controlled by a number of factors (energy we send in, fluorescence efficiency, measurement depth, etc.) but here our comparisons will make use of the factors. This means that when you see a difference in peak height, you are looking at a change in the number of atoms.
Secondly, our analysis will be qualitative. Because we are doing non-destructive analysis, we are at the mercy of anodization, thin glass layers, and other trickery in Mac products.
With that said, first question. What is going on with the aluminum in Apple products?
Aluminum
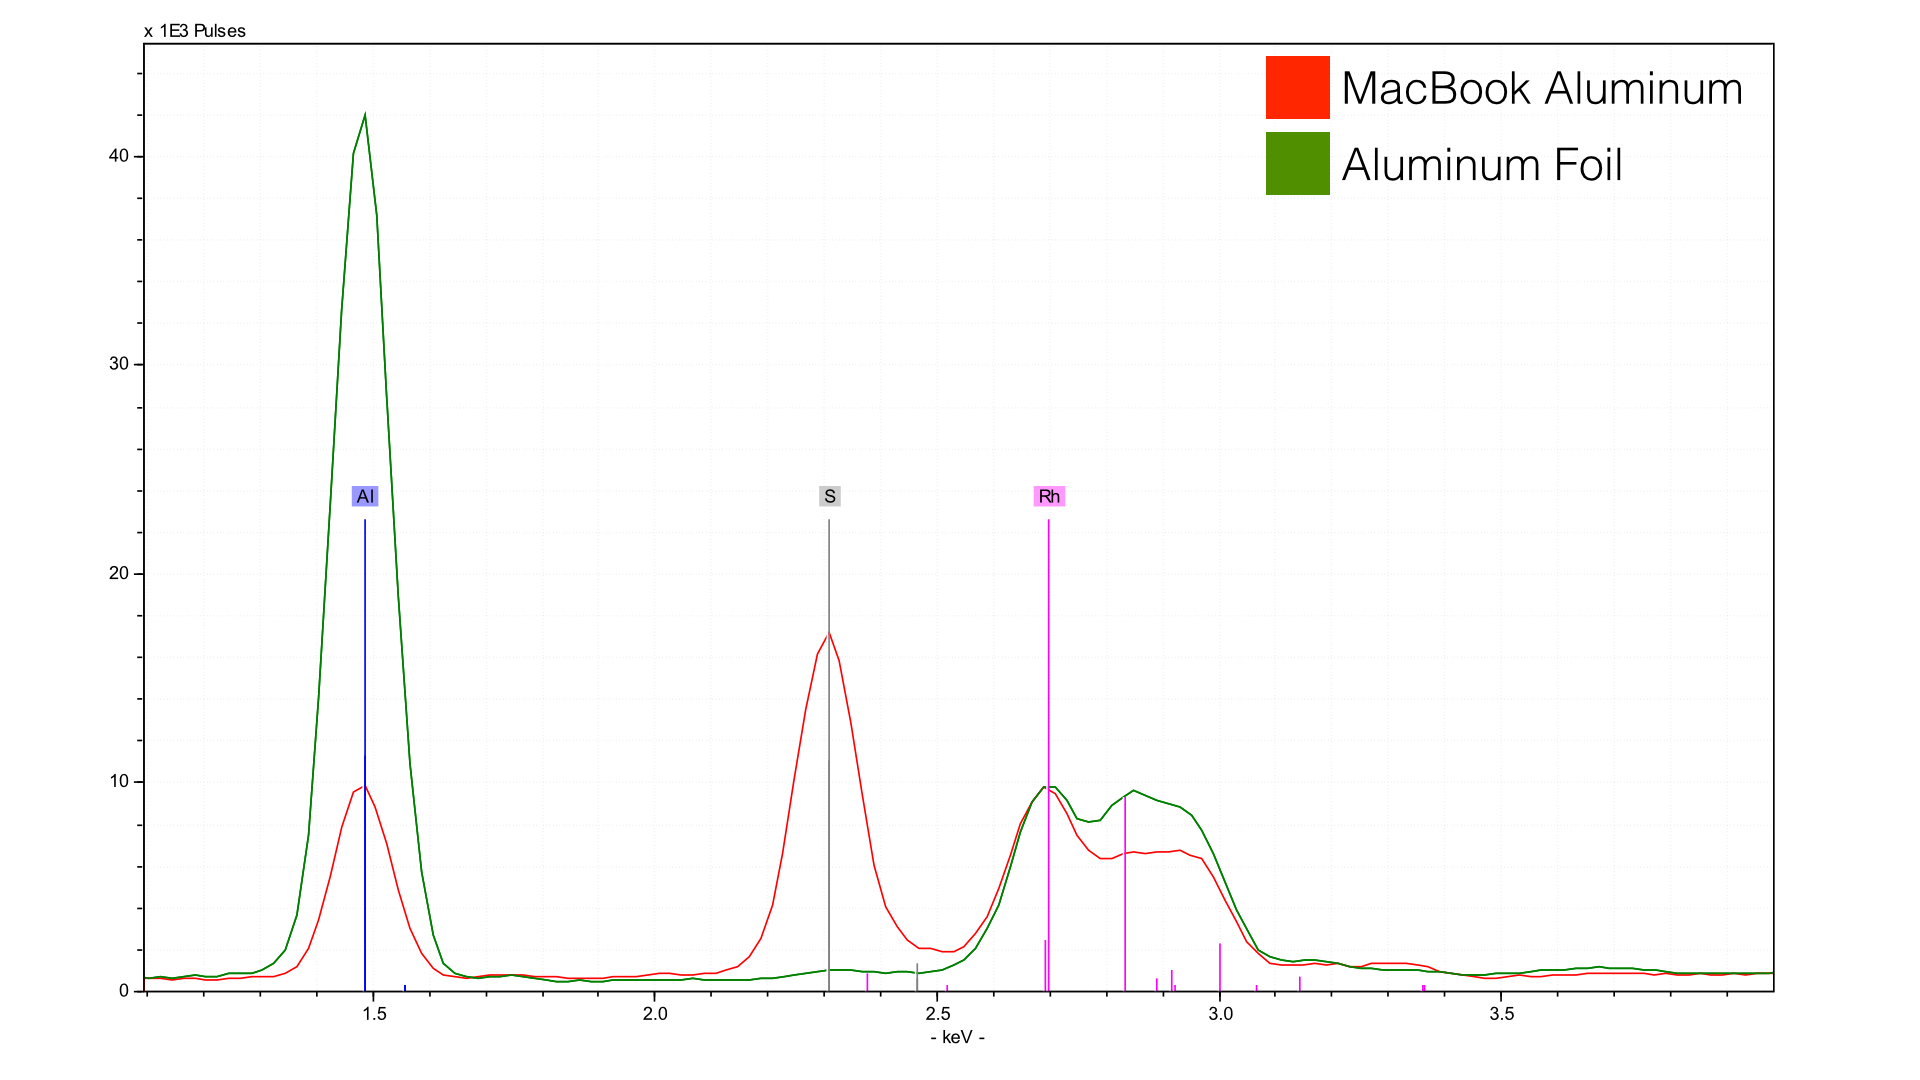
The green line is just over the counter aluminum foil for a control (Reynolds Wrap). The red line is from a new Gold retina Macbook (rMB, 8,1). First - notice the height of the aluminum peak in the foil in comparison to the Macbook? Both are made of aluminum alloys (Al), but what is happening to the Macbook is the effects of anodization, essentially a bath in sulfuric acid. You can see the sulfur peak (S) to the right which is almost as high as the aluminum peak. This is only my interpretation - but it looks like there is a mixed layer of sulfur and aluminum over the surface of the Macbook. So when you touch the Macbook, or iPhone, or iPad, you aren't actually making contact with the aluminum so much as a layer of sulfur oxides.
We can also shift gears and take a look at the trace elements present :
We can also shift gears and take a look at the trace elements present :
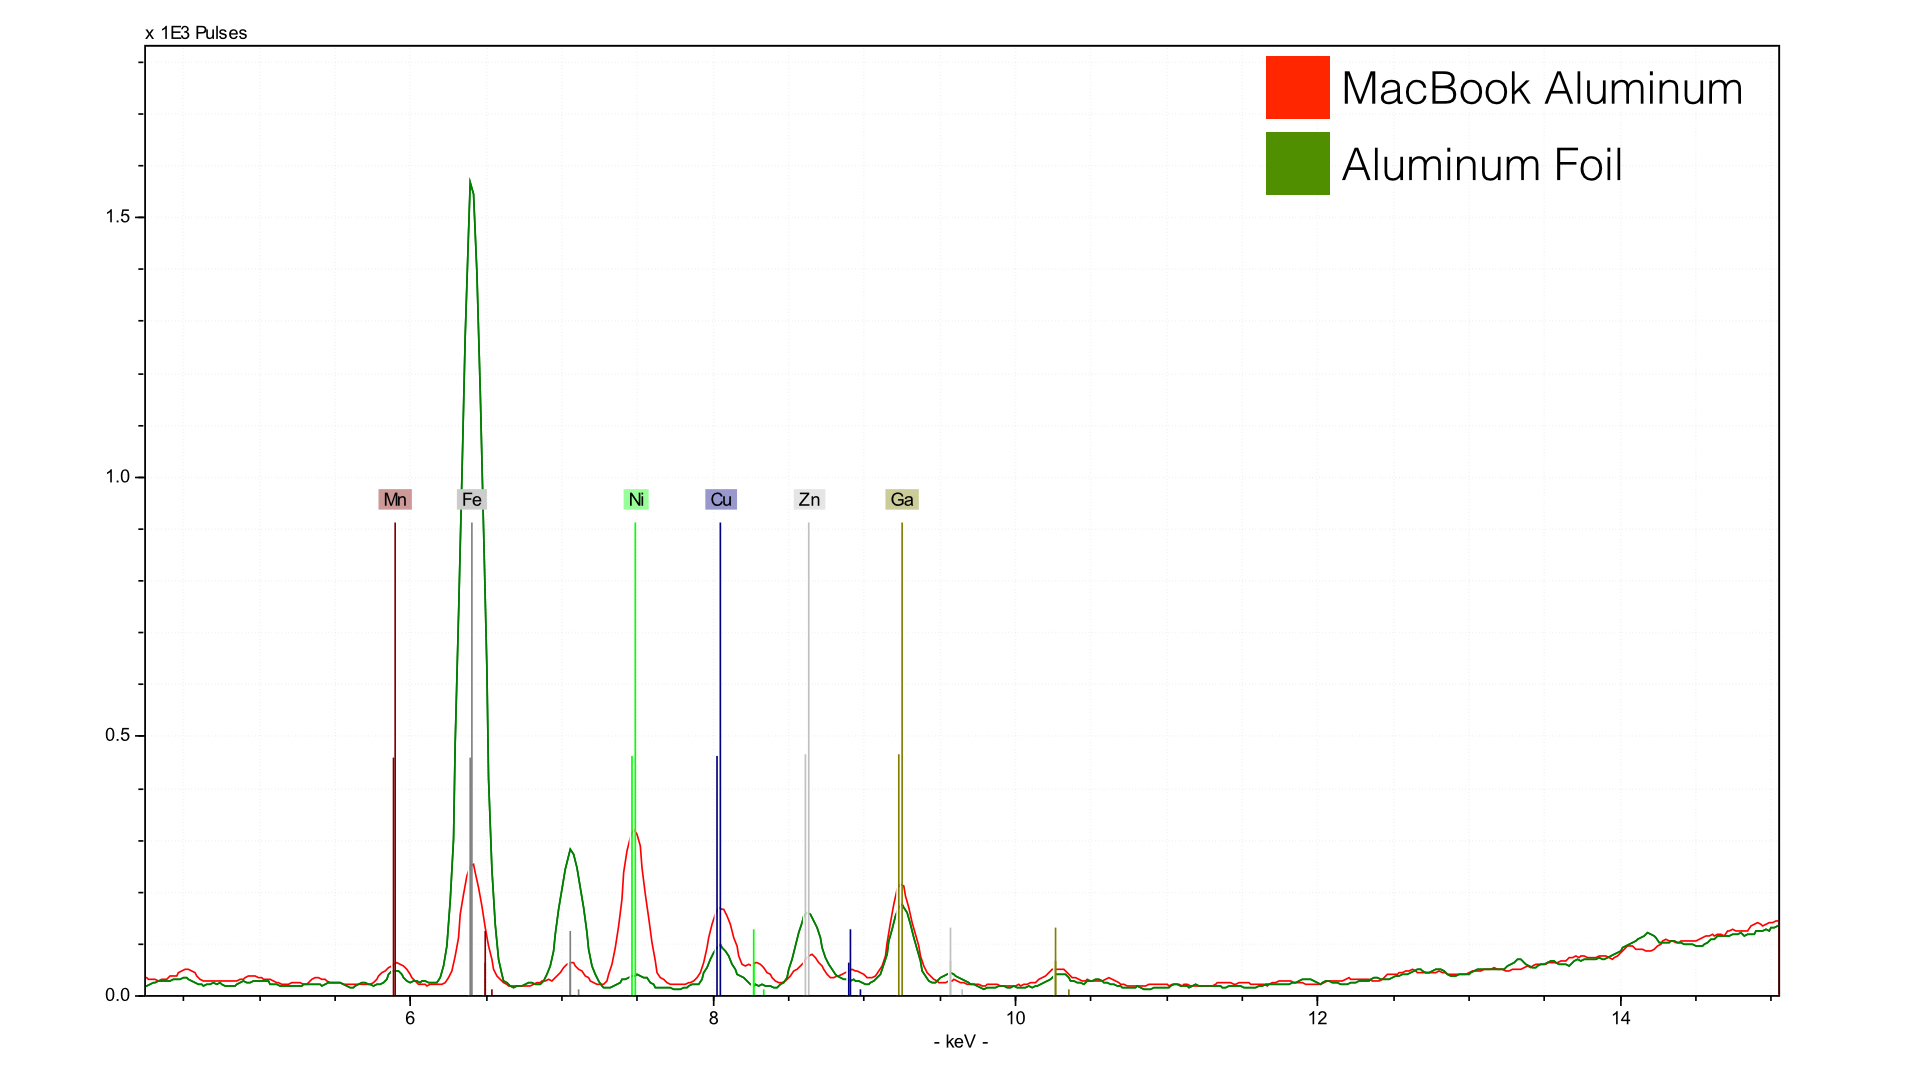
Reynolds Wrap has a fair bit of iron (Fe), likely to give it a bit more strength and color. The Gold rMB has a lot more nickel (Ni) and a little more copper (Cu). Both have gallium (Ga)- which is likely uninentional. Gallium sits just below Aluminum in the periodic table and has the same number of valence electrons in its outer orbital. Gallium is, in short, a hitchhiker that is along for the ride.
Apple’s iStuff now comes in 3 different colors, Silver, Space Gray, and Gold. What are the differences between these colors? I used a Silver iPhone 6, Space Gray iPad mini, and the same Gold retina Macbook.
Apple’s iStuff now comes in 3 different colors, Silver, Space Gray, and Gold. What are the differences between these colors? I used a Silver iPhone 6, Space Gray iPad mini, and the same Gold retina Macbook.
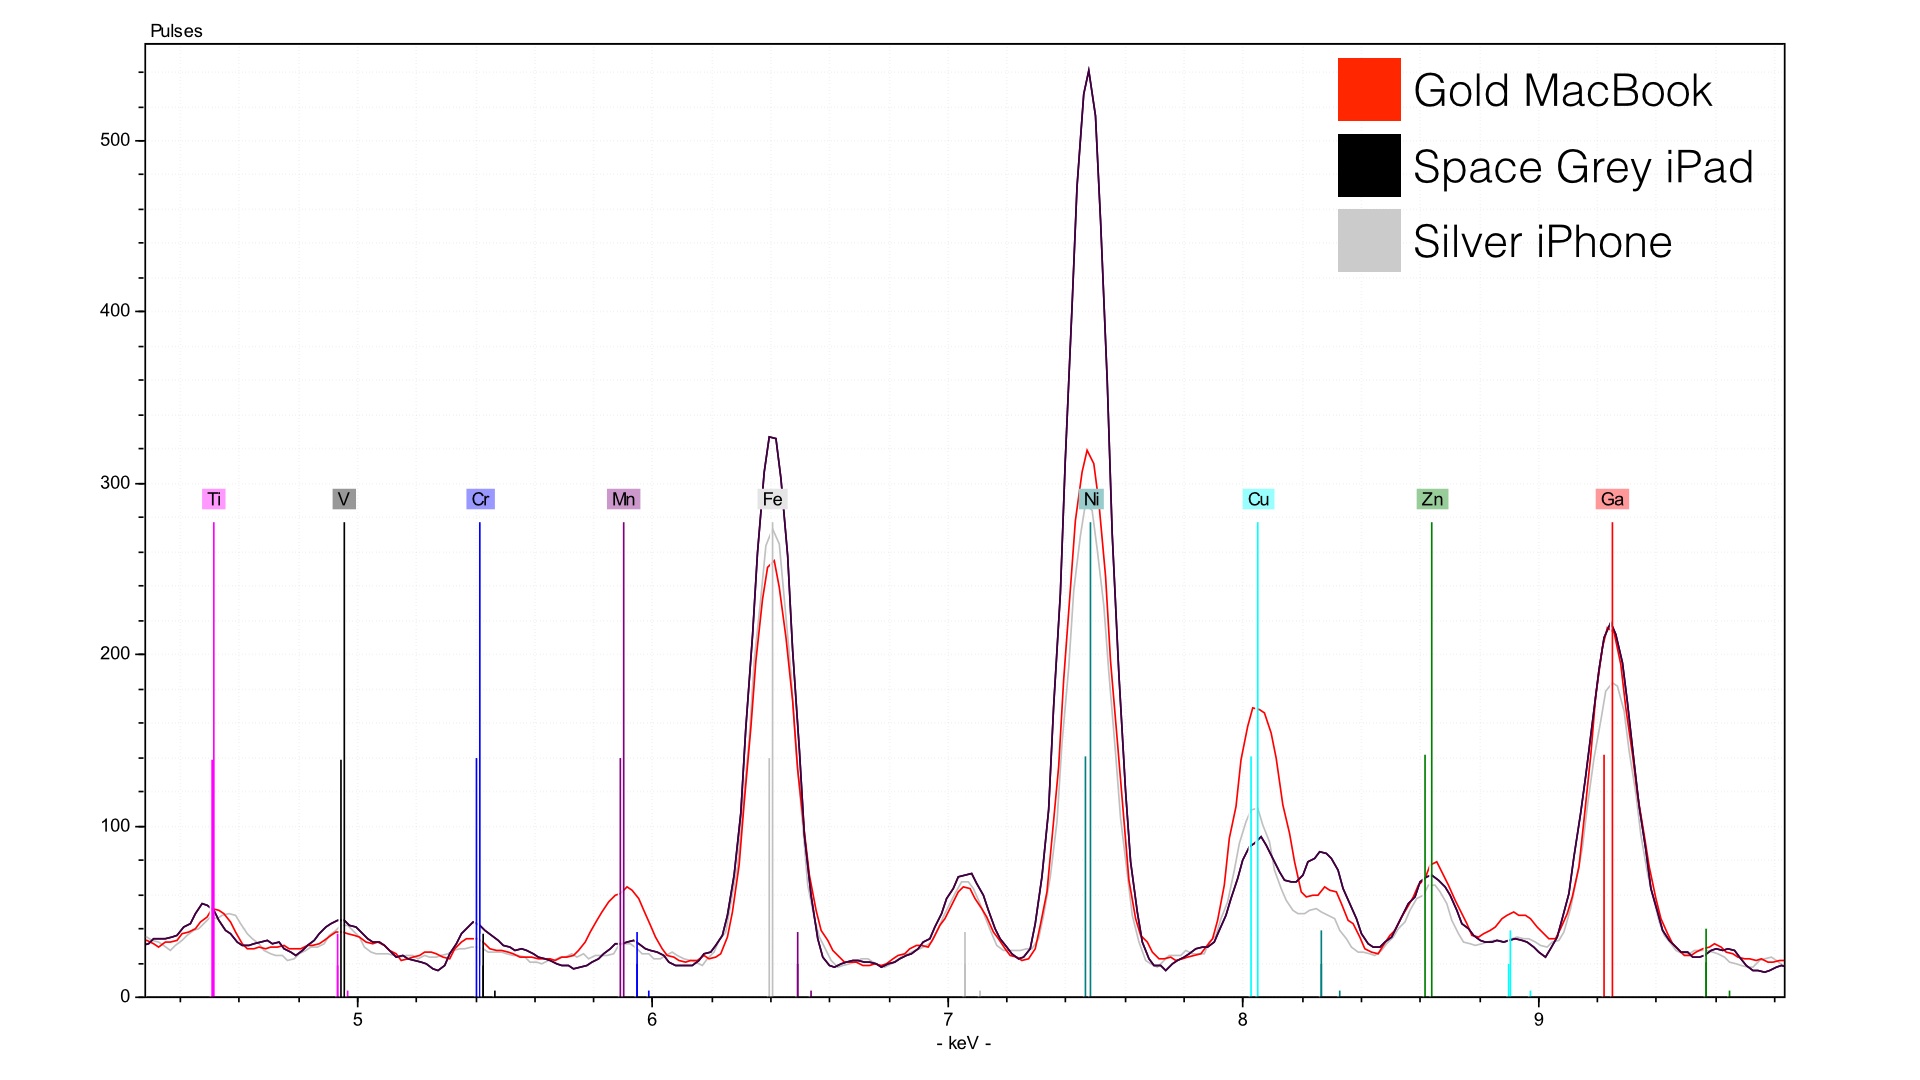
The answer is not too much, but subtle variations give us clues as to how Apple achieves its colors. First, note that Space Gray iPad has more iron (Fe) in it than the other two. Reduced iron has a black color, while oxidized iron has a red color (rust). My SWAG (scientific wild ass guess) is that reduced iron is being used to achieve the black color. Note that Space Gray iPad and Silver iPhone both have the same amount of nickel (Ni). The Gold rMB is quite different - it has more copper (Cu) and more… …Manganese (Mn)? That’s strange. I am not sure what is going on here. Manganese oxide has a purple color, and actually was one of the first color additives used in Bronze Age glass. It also was used by the Maya as a dark pigment for their temples. Perhaps here it is being used to mute the copper to give a more orange, gold-like look. But I am lost - maybe someone out there more familiar with metallurgy and/or anodization can shed some light.
Speaking of light, Apple has been shifting to using metal logos in place of the backlight. We can see what this is made of.
Speaking of light, Apple has been shifting to using metal logos in place of the backlight. We can see what this is made of.
Metallic Apple Logos
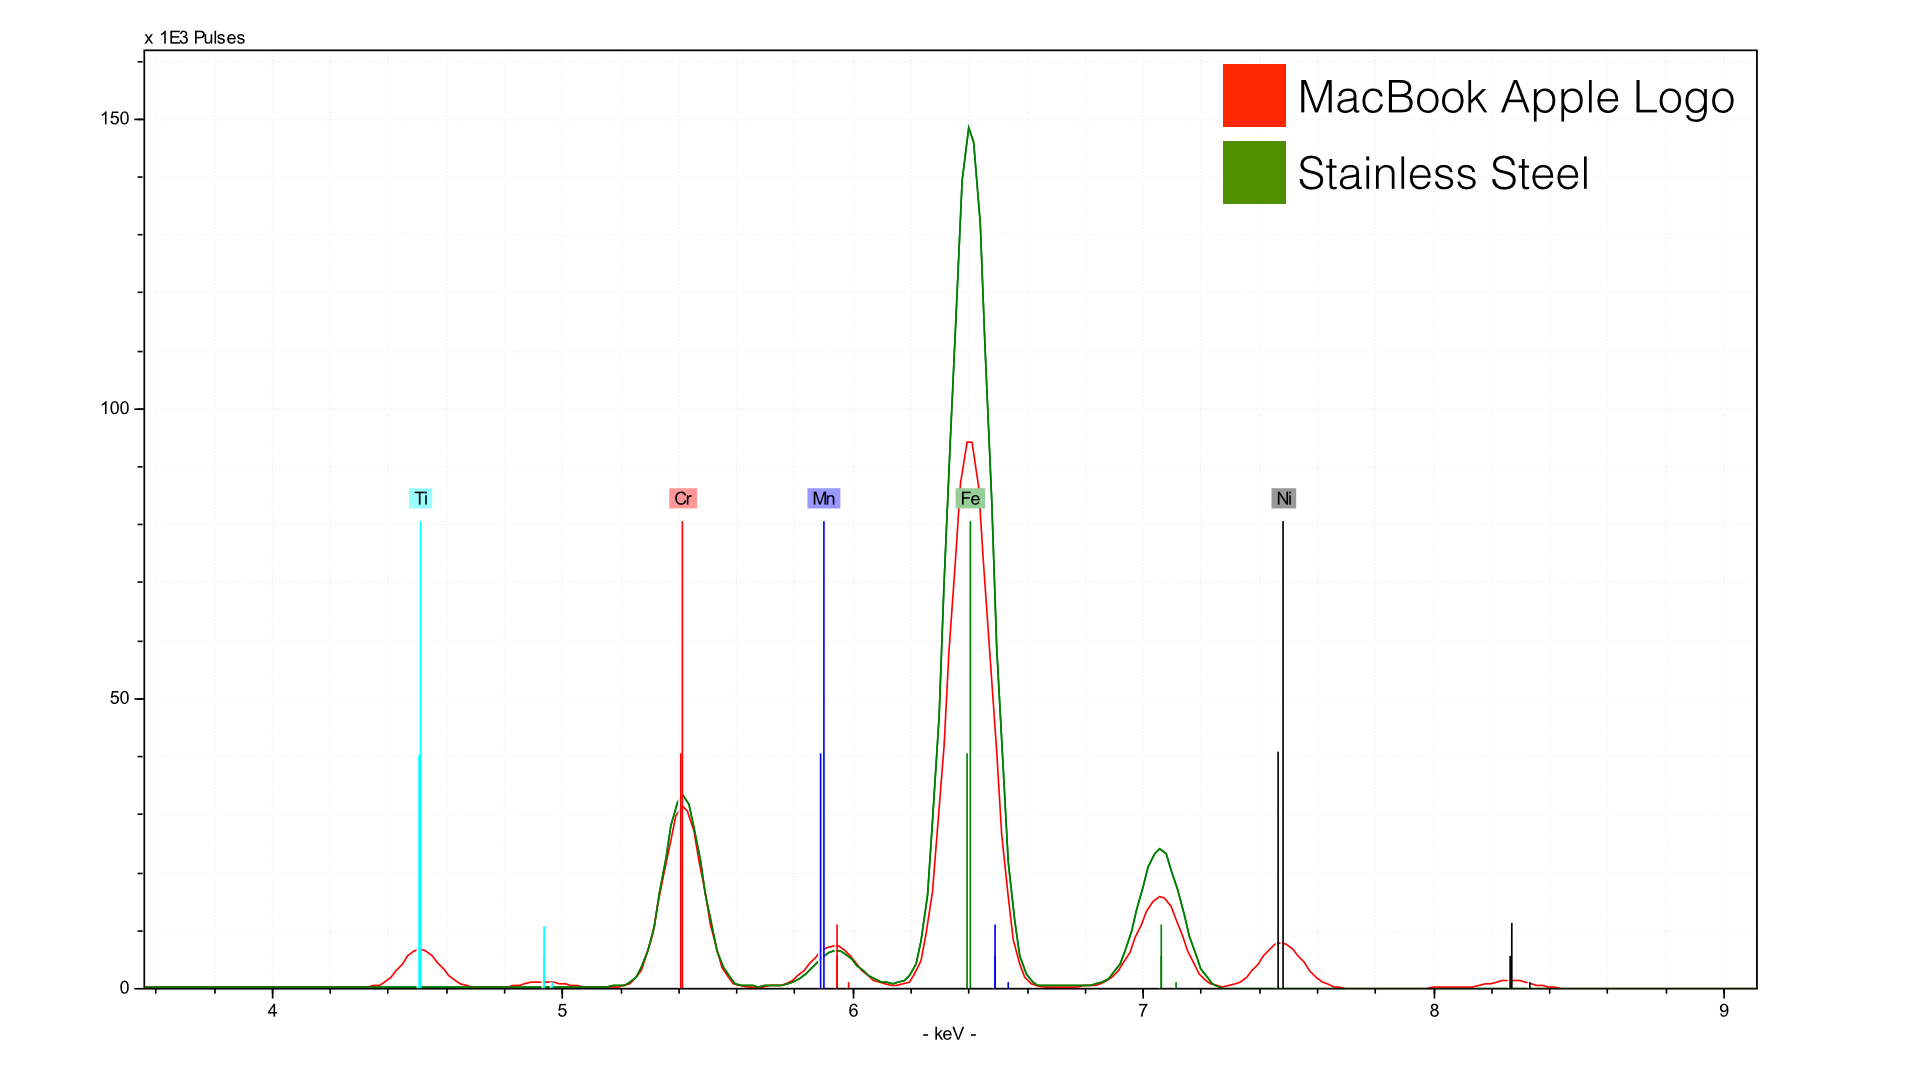
Here, we are comparing the Gold rMB to a piece of stainless steel - you get the picture. The Apple logo is a stainless steel, but it has more nickel (Ni) and titanium (Ti) relative to my reference material (a knife from the kitchen). We can also compare the Apple logos from the three color types, Silver, Space Gray, and Gold:
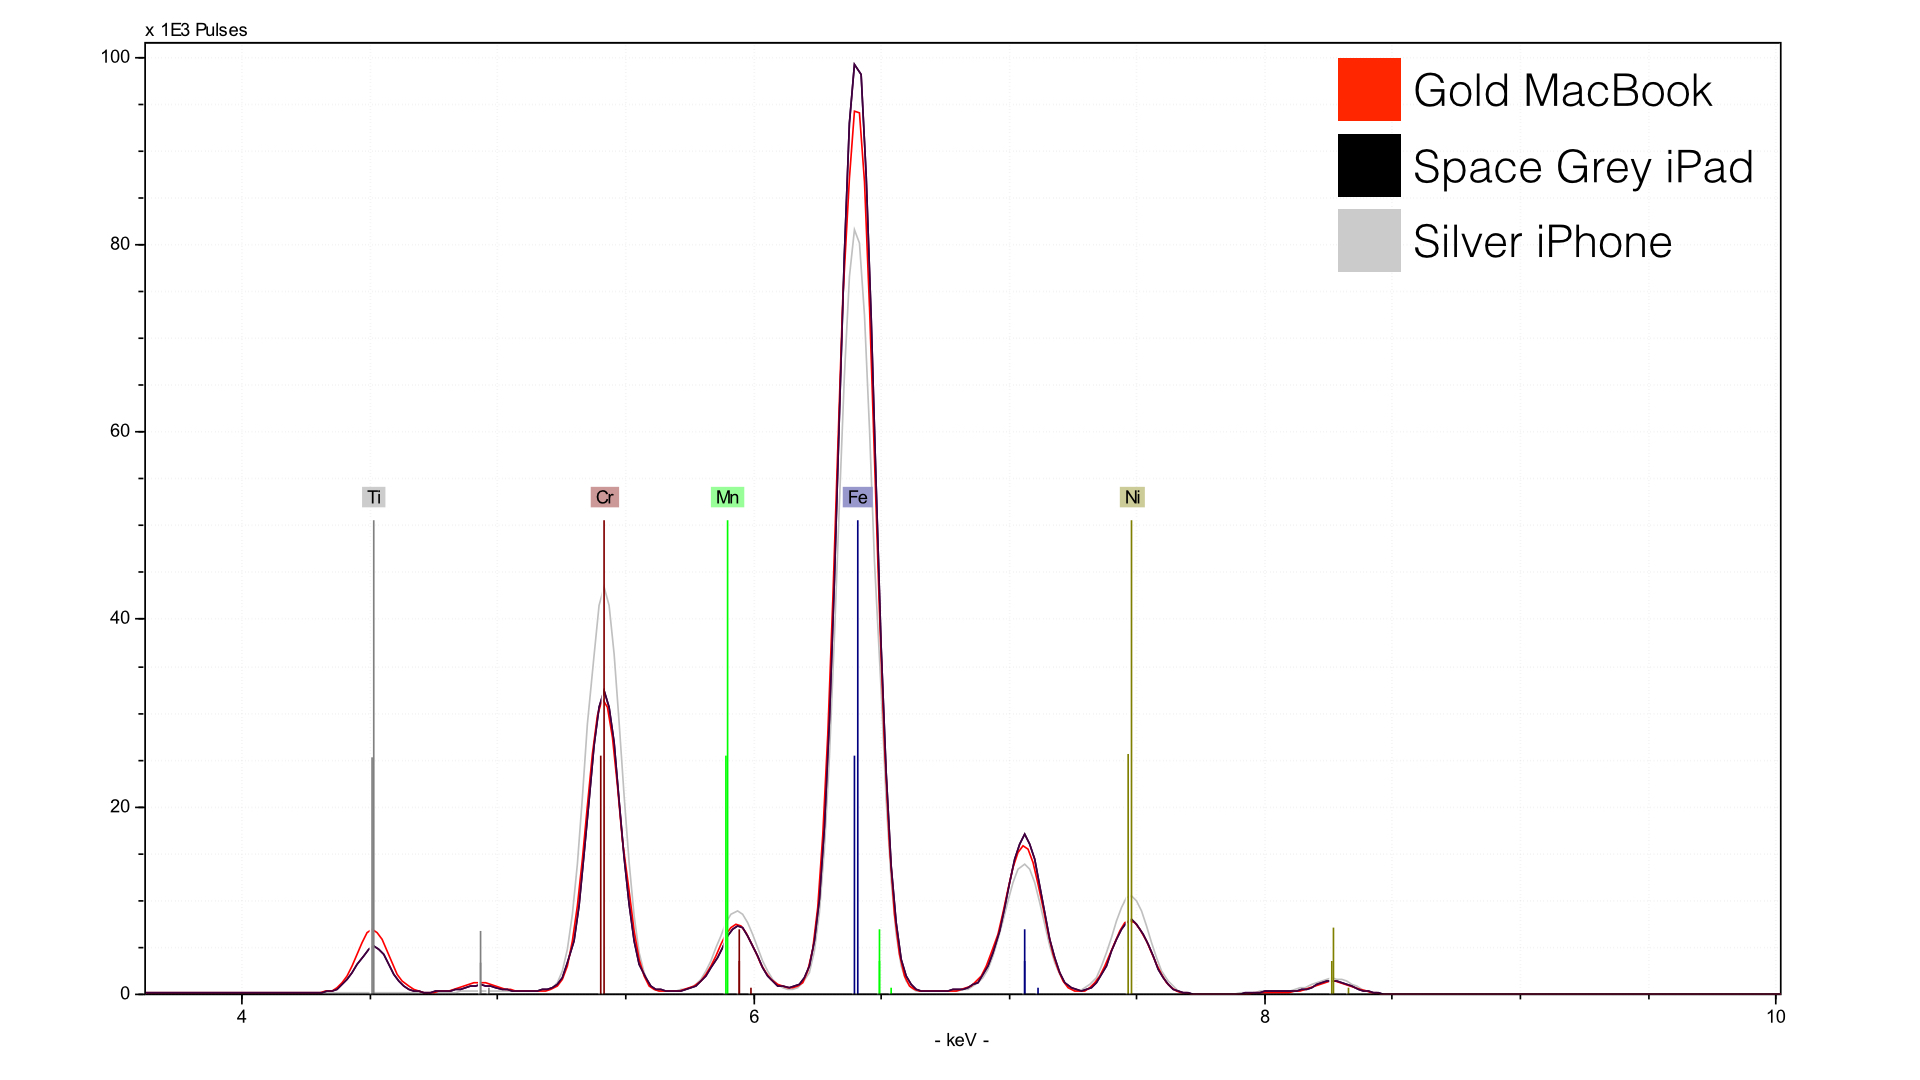
The Silver iPhone 6 used a bit more chrome and nickel to shift its shade. The Gold rMB has more titanium (Ti) but no copper (Cu) - this color affect is achieved differently than it was in the aluminum. Space Gray, as is the pattern thus far, us using more iron (Fe), likely in a reduced state. Things get more interesting if we look at higher energies:
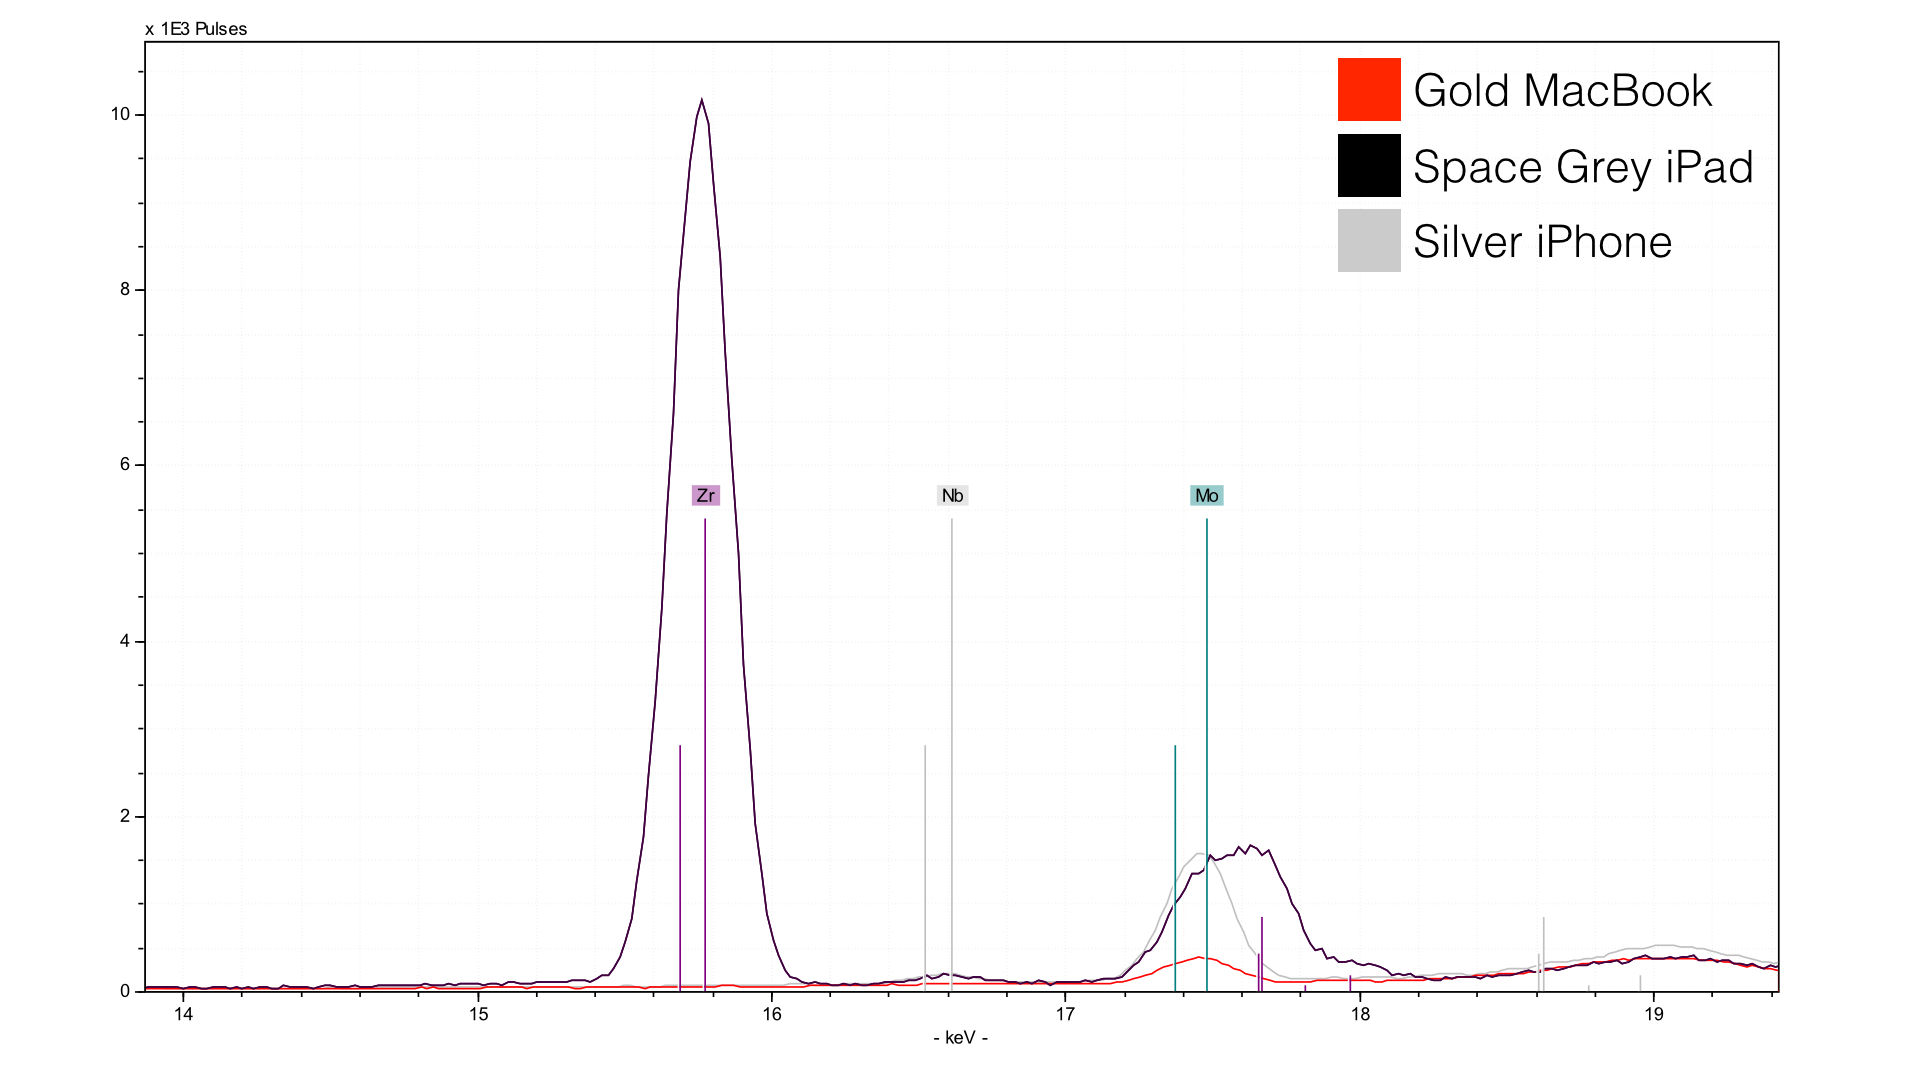
I have no idea what zirconium (Zr) is doing in the Space Gray anodization option, or why it is totally absent from the Gold and Silver. I haven’t seen this before, and I analyze lots of weird stuff. The molybdenum (Mo) you see is a common additive to iron alloys, its pretense is not surprising, though it is much higher in the Silver iPhone than it is in the gold rMB. Not sure what to make of this - perhaps additional molybdenum helps achieve the color they are going for.
Perhaps the most interesting details come from turning the x-rays onto the glass.
Perhaps the most interesting details come from turning the x-rays onto the glass.
Glass
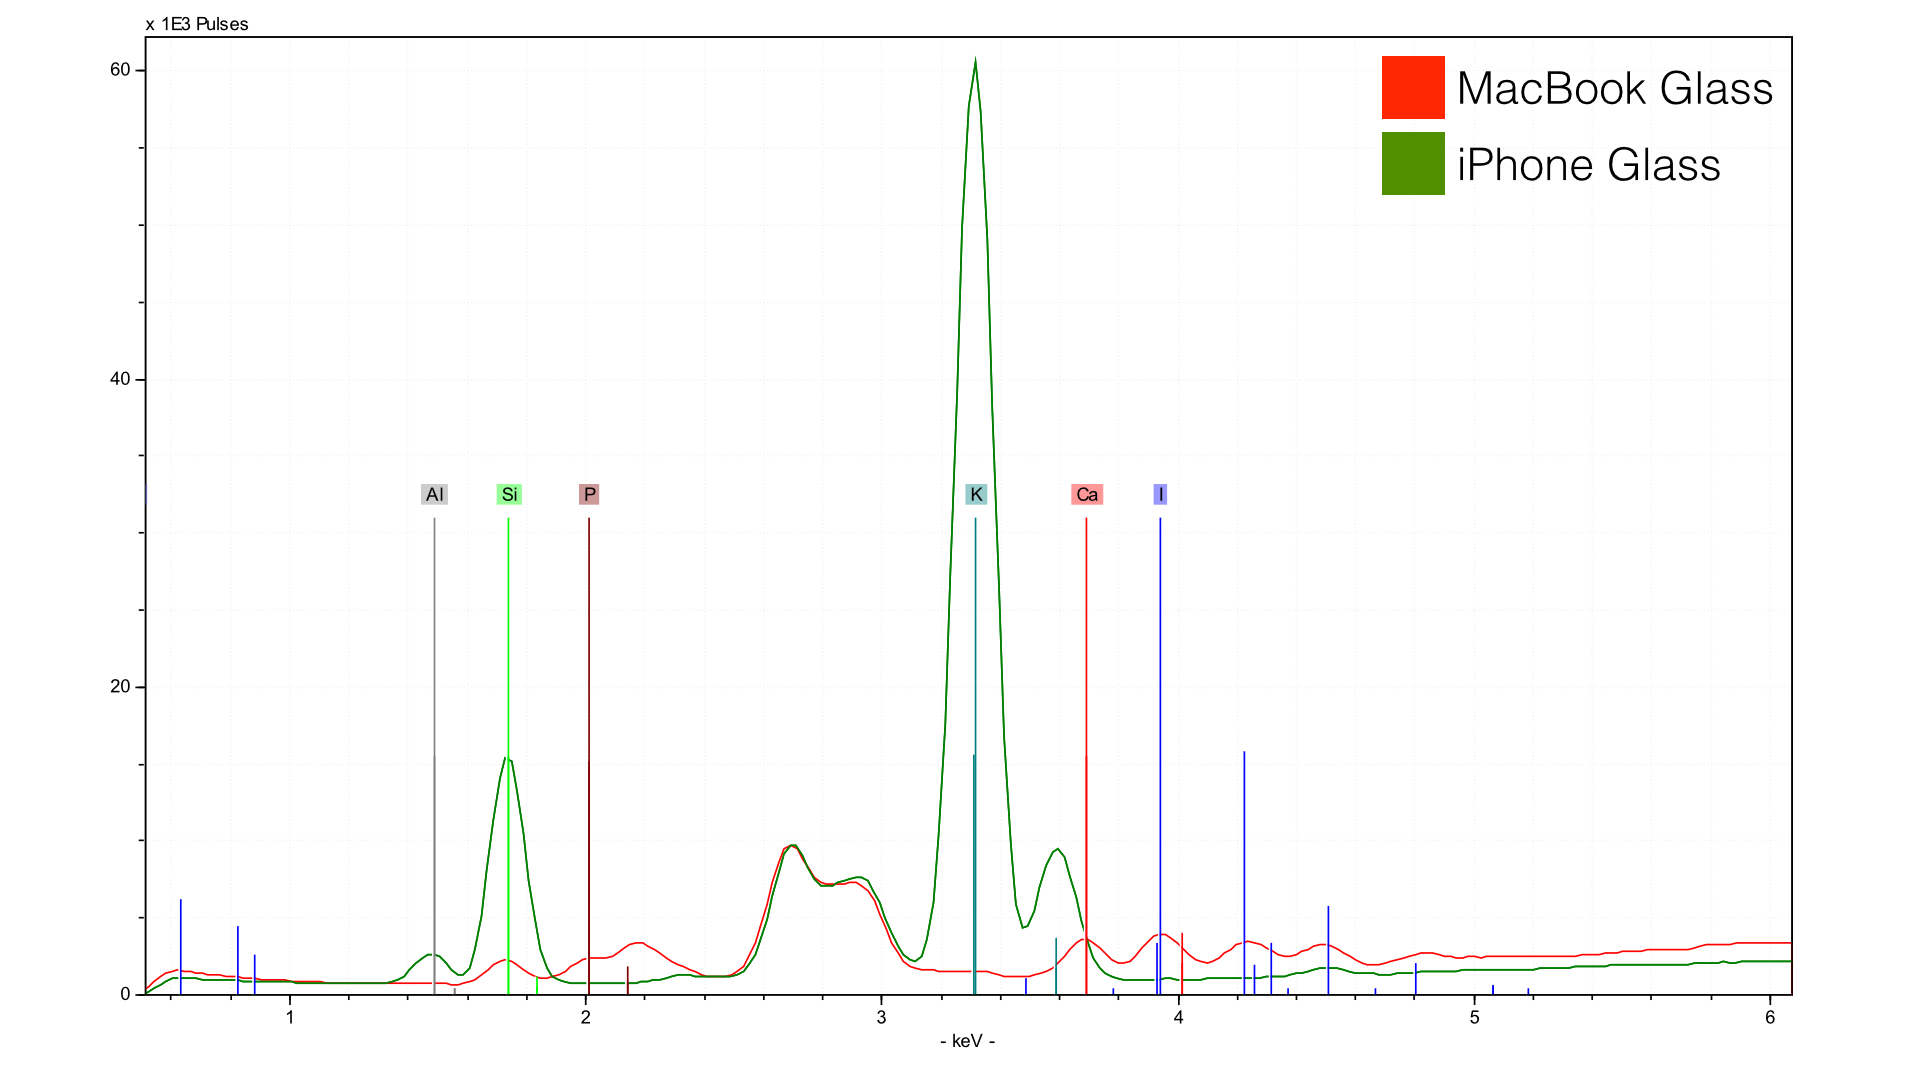
Let’s focus on the iPhone first. Corning revived the Gorilla Glass concept with the original iPhone, though those first phones had an unwelcome amount of arsenic (yes, it’s come up when analyzing old iPhones). They have been arsenic free for a while - but how did they attain that strength? The answer is in the potassium (K). This is one of the strongest forms of glass, and also one of the oldest. The first glass was made in part by adding volcanic ash to clay melted at high temperatures - the volcanic ash had lots of potassium. Corning did invent a new king of glass (kinda), but by borrowing from the deep history of glass making. The sediment source for the glass had lots of aluminum (Al) and silicon (Si).
Things get weird when we look at the rMB glass. First - very low silicon (Si) - at first I thought we weren’t looking at glass at all, but the X-rays are behaving as if it were glass (too little inelastic scatter to be plastic). However, I think the iodine (I) peaks to the right give us the answer - the glass is coated with iodine. I’m not sure about this - but it would explain the low silicon (Si) peak since it is low energy and would have a tough time getting through the glass. I put up [URL=“http://www.xrf.guru/styled-12/page40/index.html"]a guide[/URL] if you’re interested in the attenuation of these high-energy photons. But long story short, for elements like aluminum, silicon, or phosphorous we are only analyzing 40 or so microns (0.001mm) deep at most. The calcium is likely a trace that has come along with whatever sediment they are using to make the glass in the rMB. The phosphorous may well be part of the coating. In fact, it likely has to be to show up with glass.
If we shift to higher energies, things get weird.
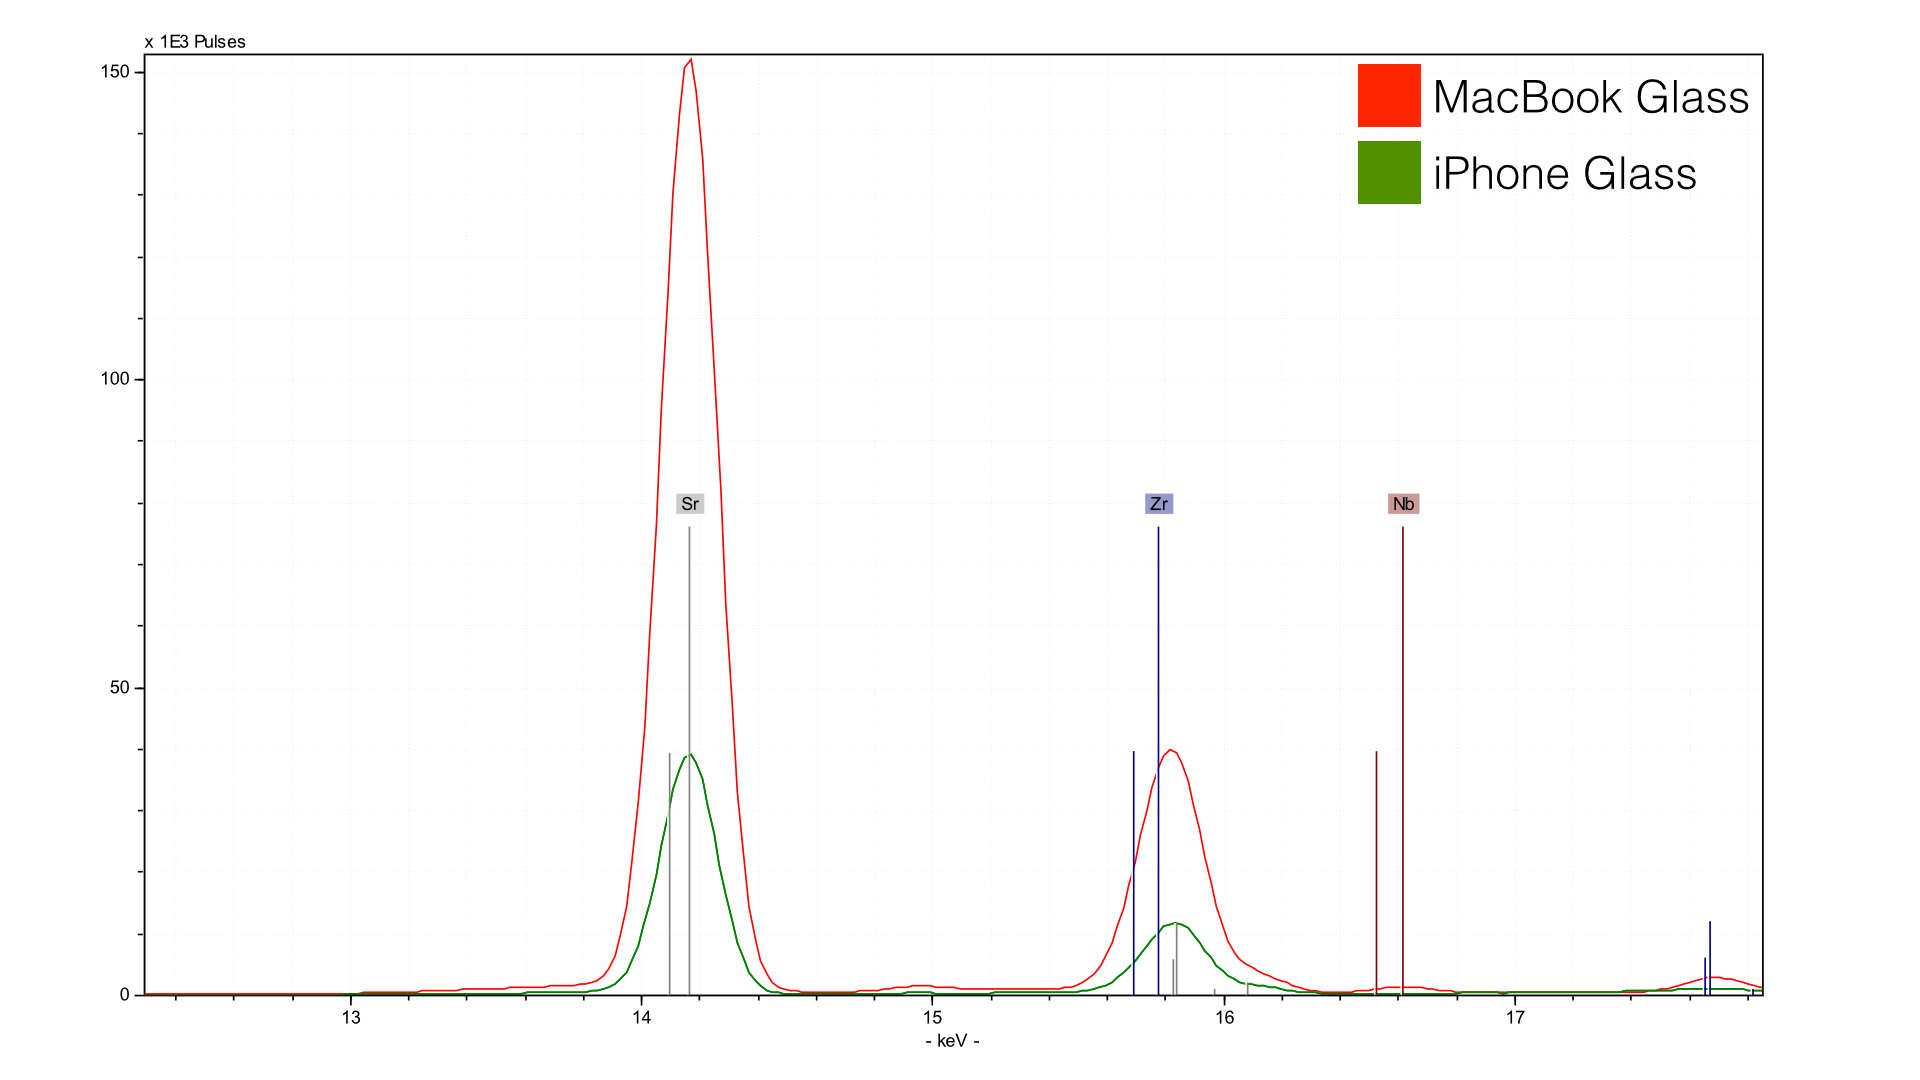
That’s lots and lots of strontium (Sr) you are seeing. Strontium can serve as a strengthening agent, so that may be what we are seeing here; more strontium is used in the rMB to add strength as it is not Gorilla Glass. If we go to higher energies, things get even weirder.
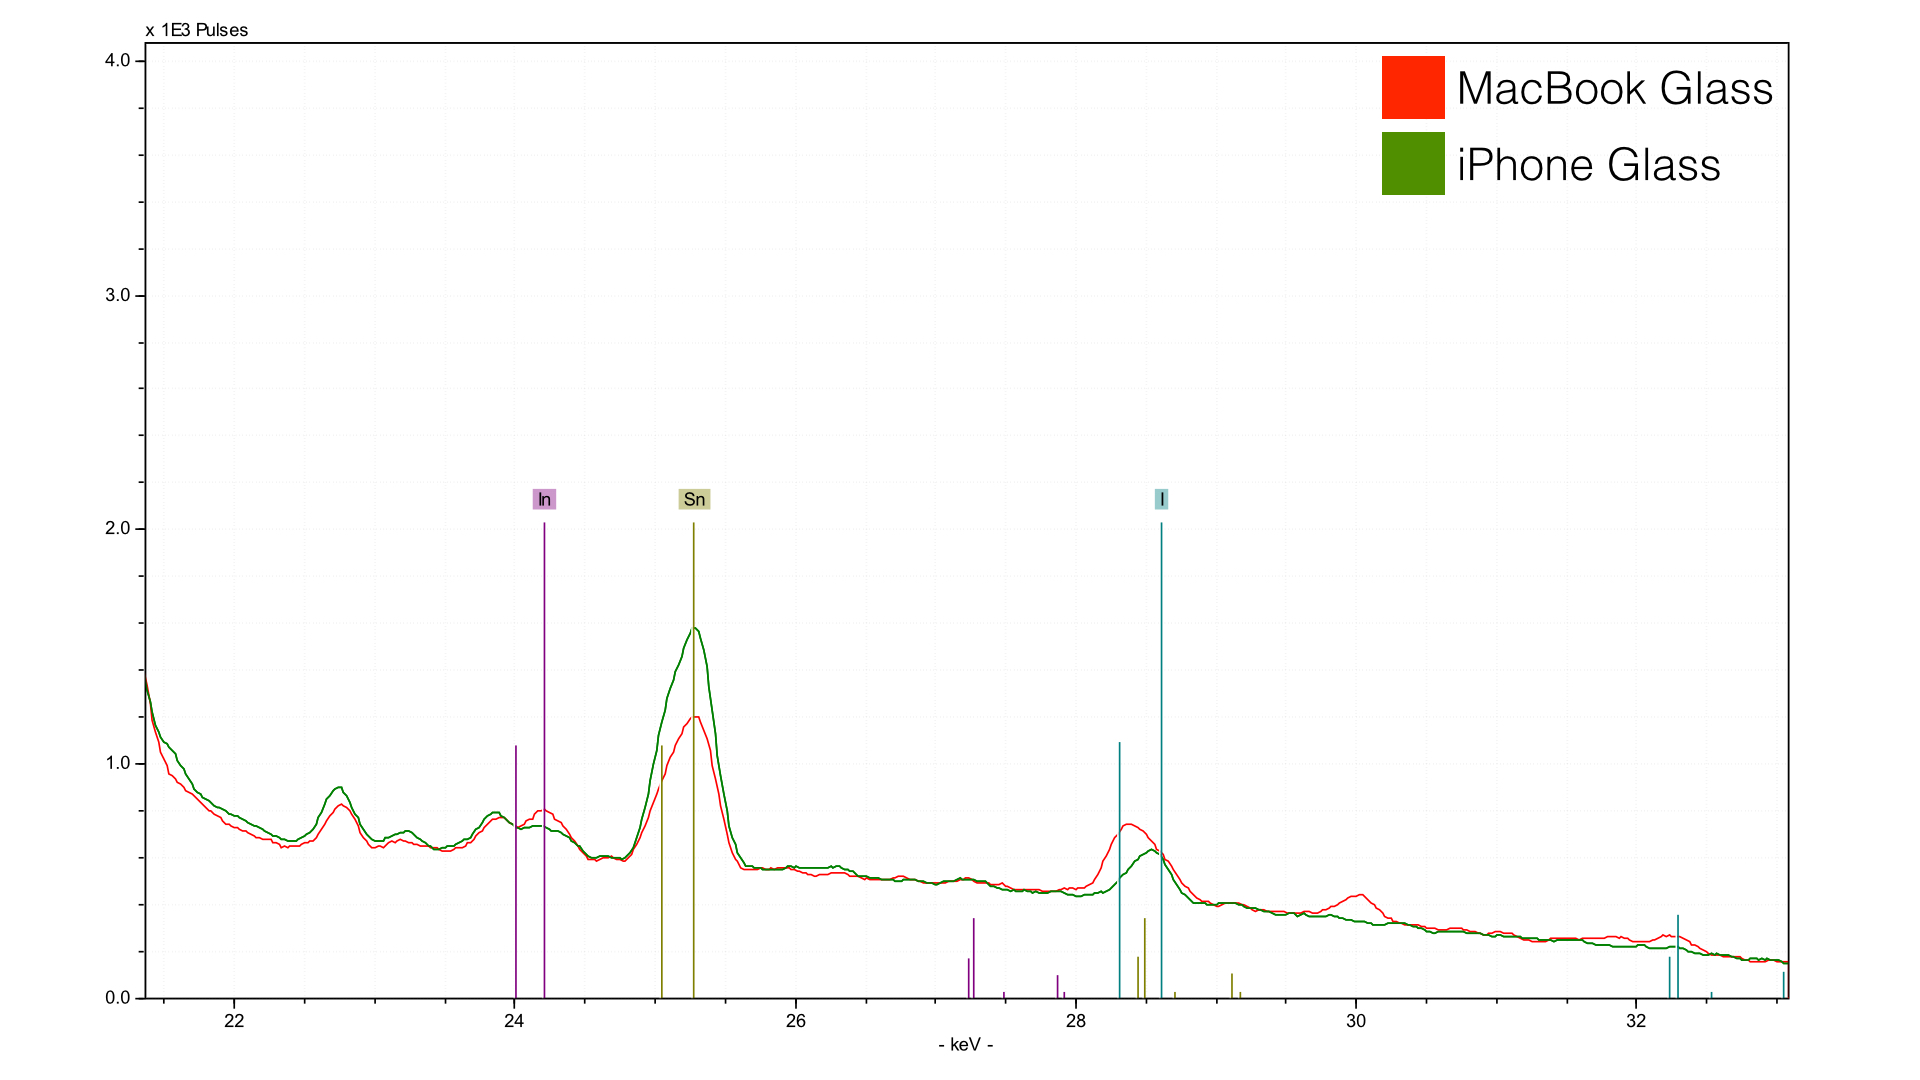
I don’t work with this part of the spectrum as often, and I probably should have used a heavier duty filter. But we can still learn from this. First, the tin peak (Sn) indicates the method of manufacture. After speaking to various people smarter than I, i seems that they are pouring the glass mixture onto a small pond of liquid tin. The glass cures at a lower temperature than the tin, which is still a liquid. This helps create an ultra-flat surface, critical for touch input and precise fitting. But, a little tin comes for the ride. The element that I did not expect was indium (In) - could this perhaps indicate an IGZO (indium, gallium, zinc oxide) screen? I am not sure, because gallium (Ga) and zinc (Zn) are present in both the iPhone and Macbook glass. Also, I analyzed a retina Macbook Pro from late 2012, and it also has indium (In). We are measuring that element at quite a depth since it is higher energy, so I could be hitting a component within the screen as well. The only way to know for sure would be to remove one of these screens and measure the other side - but not willing to do that with my shiny new rMB.
Technical Details
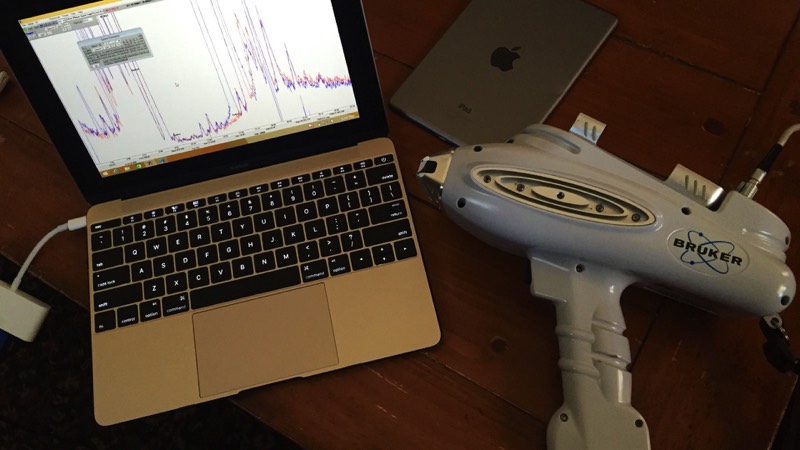
Feel free to skip if your not interested in how this analysis was conducted. First, a Bruker Tracer IIISD was used - this has a 2W Rhodium anode with a silicon drift detector (SDD) capable of a Full Width Height Maximum (FWHM) of 150 eV with a count rate of 200,000 photons per second, though these measurements fell a bit below that (which is better, actually). I used 40 keV combined with 30 μA - multiply the two together and I was using about 1.2 watts, about as much as an electric screwdriver. For light elements I used no filter - effectively using the XRF instrument like a scanning electron microscope but without the electrons. For trace elements like zirconium and molybdenum, I used a 25 μm Cu/25 μm Ti/300 μm Al filter. This essentially just cut out a lot of the background noise to get a clearer reading on those elements.
The count rate for filtered measurements was around 60,000 photons per second, while it went up to as high as 150,000 counts for the no filter measurements. The latter should have had a lower current, but since this was just qualitative analysis I didn’t mind. Each spectrum took 60 seconds to accumulate. More time is always better, but my arm started to hurt holding it up to the Macbook glass.
The count rate for filtered measurements was around 60,000 photons per second, while it went up to as high as 150,000 counts for the no filter measurements. The latter should have had a lower current, but since this was just qualitative analysis I didn’t mind. Each spectrum took 60 seconds to accumulate. More time is always better, but my arm started to hurt holding it up to the Macbook glass.